by Flint Adam, Nolensville resident & REALTOR®
“Did the market take a screeching halt or is it just me?”
That question was posed the other day by another REALTOR® in a small, Facebook group I’m in with other local agents. In my March blog, I theorized that change was in the air. In my April blog, I said the evidence was growing… that we are slowing.
Then two weekends ago everything around here just… stopped.
It was an abrupt halt to what has been a remarkable, once-in-a-lifetime run in the real estate market. Nobody has ever seen anything like we experienced the past eighteen-months. Perhaps it is fitting that the frenzy should end as abruptly as it began.
What we are entering now is a bit of an unknown, and before I go any further let me preface by saying that I am not going to sugar-coat anything. I’m not a B.S.’er… I’m not a “salesman” who is going to stroke your head and tell you it’s all going to be okay. I’ve built my reputation on being honest, evaluating to the best of my abilities, and painting as clear a picture as I can. So, here we go…
What Is Happening Right Now?
My gut tells me we’re entering a normalizing real estate market. Greater Nashville housing inventory has returned to November 2020 levels. Back then, homes were taking three weeks to sell, multiple-offers were far and few between, and the typical home sold just a little under asking price. But it was still a heck of a year!
We may even be heading back to a market like mid-2017. Back then, I wrote about how local home sales began slowing down in late March, with underwhelming activity at the start of summer. (Sound familiar?) 2017 wound up being a down year compared to the year before, with Nolensville home sales falling about 9%. It wasn’t the end of the world, though, and 2018 wound up becoming a then record-setting year.
We could, however, be heading into something more challenging. The question on some people’s minds is “will the real estate market pop?” Up until this week, I didn’t think that was likely, and when I spoke with people on the subject I always began with the phrase:
“Barring a significant, wide-spread, economical change… I believe demand remains too high and inventory too low for the market to suffer a significant setback.”
I stand by that statement today. What I’m not sure about, though, is whether we are now entering a significant, wide-spread, economical change.
Last week, the latest inflation report came out hotter than expected… the highest it has been in 40 years. That news set off a chain-reaction.
Last Friday and this past Monday, the stock market suffered sizable losses and the S&P 500 fell into a “bear market”, meaning it had closed 20% below its most recent peak (January 2022).
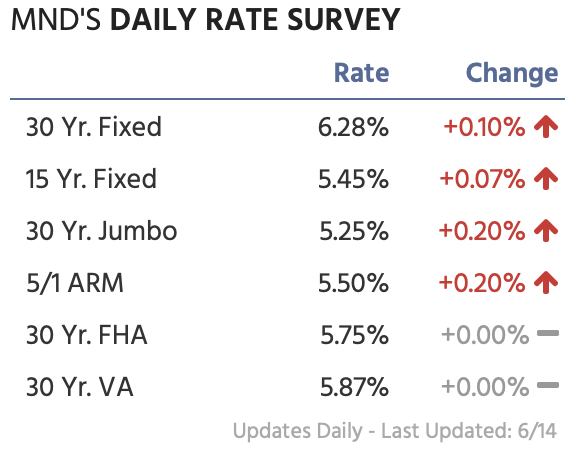 On Tuesday, the mortgage industry saw the biggest hike in interest rates since 2013. What had typically been a 5.5% interest rate on a 30-year home loan the week before had suddenly jumped to 6.28%.
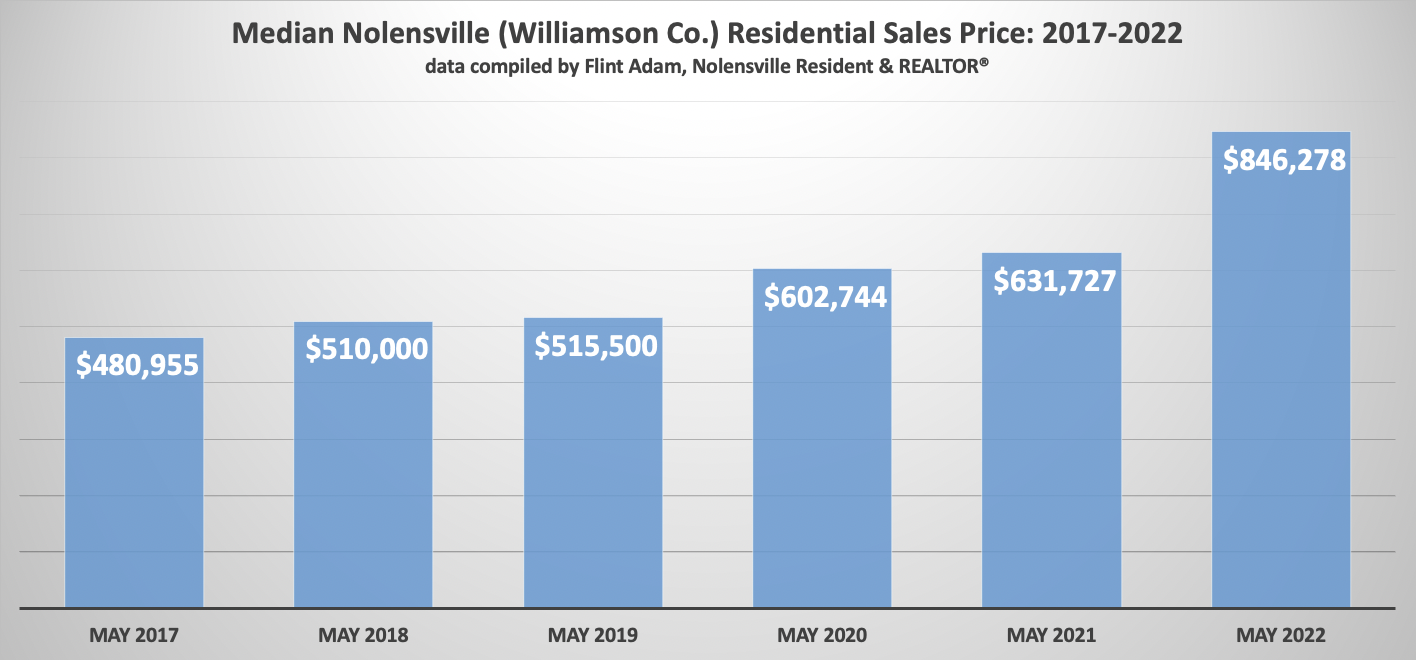
So, what does that equate to? Say, for instance, you are purchasing a Nolensville home at last month’s median price of $846,278. You have good credit and put down 20% toward the purchase. According to my buddy, Jesse Alvarez, with The Mortgage Exchange, your principal+interest looks like this:
– Last week at 5.5% = $3,844/mo
– This week at 6.28% = $4,182/mo
Your monthly mortgage would have jumped $338/mo over the past week. That’s a not-insignificant loss in purchasing power.
New mortgage demand has fallen to the lowest level in 22 years. Home-builder sentiment has dipped to levels not seen since COVID-19 erupted in early 2020, and now the Fed is hiking the prime rate another 75 basis points, with several more rate hikes in the works this year. Despite the aggressive action, Americans are losing faith in the Fed’s ability to combat inflation.
Finally, housing inventory is rising, both locally and nationally. From Realtor.com®:
Last month, the number of new listings that hit the market rose for the first time since June 2019, according to a new report from Realtor.com®. As a result, May home shoppers had 8% more active listings to scroll through compared with this point last year.
Local Housing Inventory Is Sitting…
Up until a few weekends ago, homes in Nolensville were still selling fast despite a significant drop in foot-traffic and number of offers. But then school let out, summer vacations began, interest rates rose, and housing inventory grew.
In the blink of an eye, fewer homes were selling, yet more kept on coming to market. That began changing buyers’ perception. I also saw and heard that some buyers started getting cold feet or learned they could no longer afford as much home as they thought they could. Some contracts even began falling out.
Twenty-eight subdivision homes were available for purchase this past weekend in Nolensville (Williamson County). Only four (14%) went under contract:
- 405 Ramblewood Lane, which is priced at $599,900
- 361 Baronswood Drive, which is priced at $624,999
- 104 Corbin Court, which is priced at $950,000
- 1804 Apperley Drive, which is my own listing in Scales Farmstead priced at $1,149,990.
Meanwhile, as of this writing, another seven Nolensville homes are ‘Coming Soon’. They’re arriving to more competition than the sellers likely expected. List prices are also under pressure: 20% of today’s available, Nolensville (Williamson County) marketplace has already price-reduced.
What Next?…
There remains much to unpack. We don’t know how much of the recent slow-down may be related to families heading out on vacation, but we do know a lot of folks left town. The market could pick back up again in the coming weeks as families focus on selling/buying before the start of the next school year.
We don’t know how much impact the Fed’s 75 basis point interest rate hike today will have on the economy. It’s the number the markets were expecting, but it’s not necessarily the number that’s needed to start pounding away at inflation.
As I look around the Williamson County marketplace, I see growing inventory (and days on market) in the other prime cities of Brentwood and Franklin. About 20% of the available marketplace has price-reduced, too. As we move deeper into summer, it will be interesting to see how quickly and how many homes go under contract, how many contracts fall through, how long days on market stretch out to, and how many price-reductions appear.
We’re in a transitioning market and it will take some time for reliable data to appear that guides us moving forward. My advice, though, is don’t be too aggressive in pricing your home for sale because the market may now give you the cold shoulder. If you’re a buyer, you’ve got more to pick from then you’ve had in a year and a half… but home prices are still near their peaks, and interest rates are the highest they’ve been in a decade. Talk to your lender and make sure you still qualify for what you think you do.
May 2022 Real Estate In Depth…
In many ways, last month’s sales data will stand in stark contrast with the information I just shared above. But remember, real estate sales data lags real time information. A typical closing takes thirty to forty-five days to play out, and a lot can change between now and then.
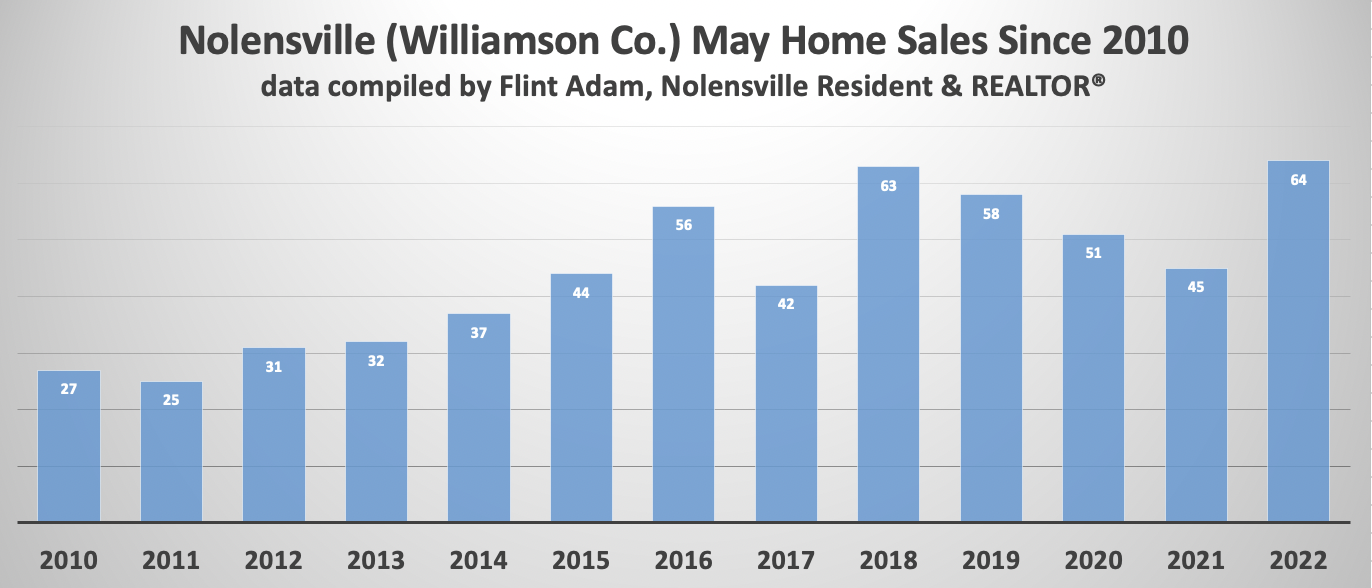
Last month, we saw the most Nolensville, May home-sales ever… and 42% higher than a year ago.
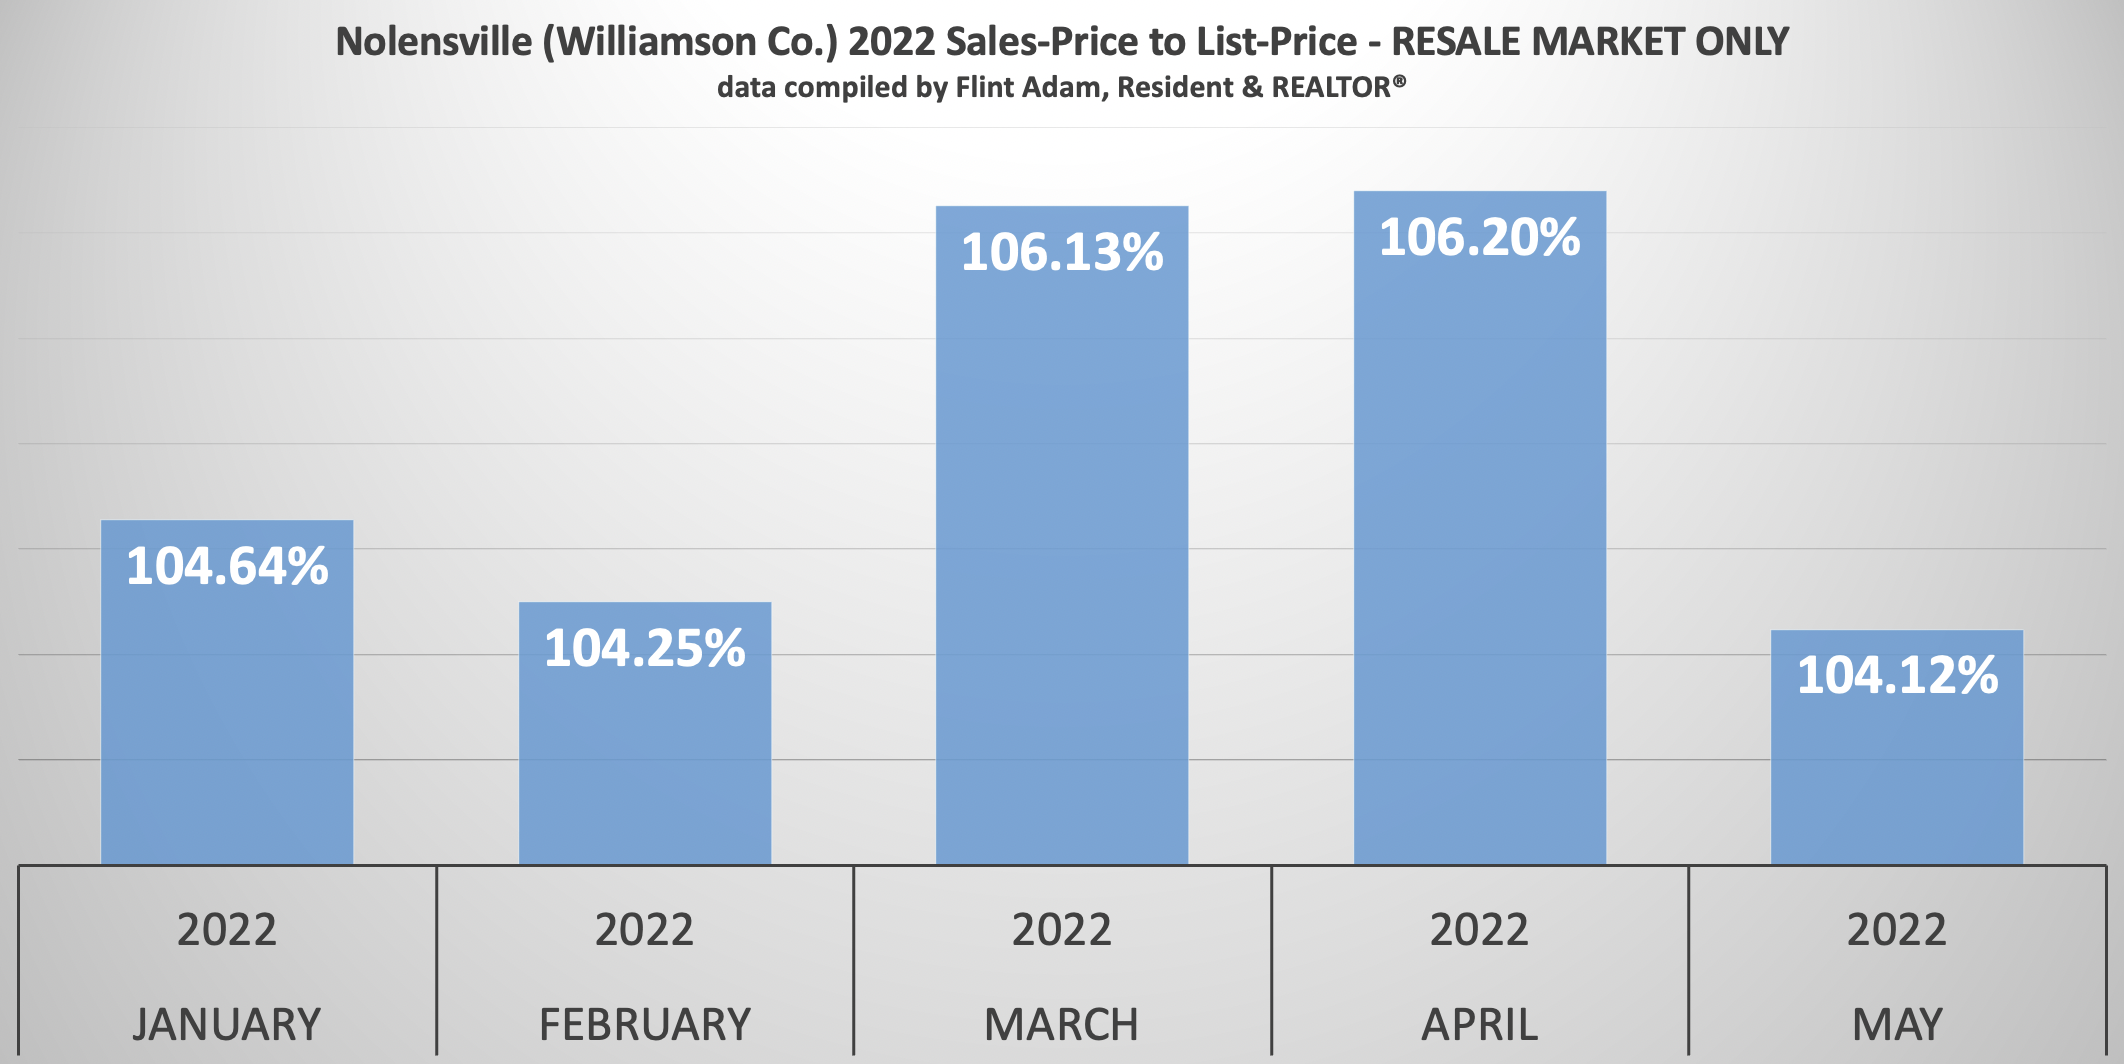
Already, though, bidding wars among resales were significantly dropping. The average sale-price to list-price ratio fell to the lowest figure we have seen so far this year. (I’m expecting another significant drop in the June numbers).
Meanwhile, the median sales price in Nolensville dipped slightly (-1.01%) from last month, but was still 33.96% higher than it was the year before.
May 2022 vs. May 2021 Nolensville Home Sales:
- 64 Nolensville (Williamson Co.) homes sold… up from 45 (+42.22%)
- The median sales price was $846,278… up from $631,727 (+33.96%)
- The average days on market was 5… down from 13 (-8 days)
- The sales-price to list-price ratio was 101.76%… down from 102.55% (-0.77%)
- 32 of the 64 homes (50%) sold were new construction
- The lowest price sale was 312 Thesing Ct. in the Bent Creek 55+ section for $487,500.
- The highest price sale was 441 Oldenburg Rd. for $1,850,000.
Deeper Dive:
- When we eliminate new construction and larger acreage properties and look solely at subdivision resales (31 total), some interesting figures come to light:
- The median sales price becomes $799,000
- The average sales-price to list-price ratio grows to 104.26%
- 20 of the 31 sales (65%) are above asking-price… anywhere from $9,010 to $150,000
- 2 of the 31 sales sold (3%) below asking-price.
- The average overage of the above-asking price sales is $53,087
- All-cash purchases make up 16% of sales
- The average days on becomes 4
- 1 of the resales had a contract fall through before selling
- 2 of the resales had to price-reduce before going under contract
*Note: The information above cites Williamson County sales data for Nolensville, Tennessee. There is, of course, a small percentage of Nolensville homes that exist in Davidson and Rutherford counties, but for continuity in my blogging I reference only Williamson County statistics.
Williamson County Sales Stats…
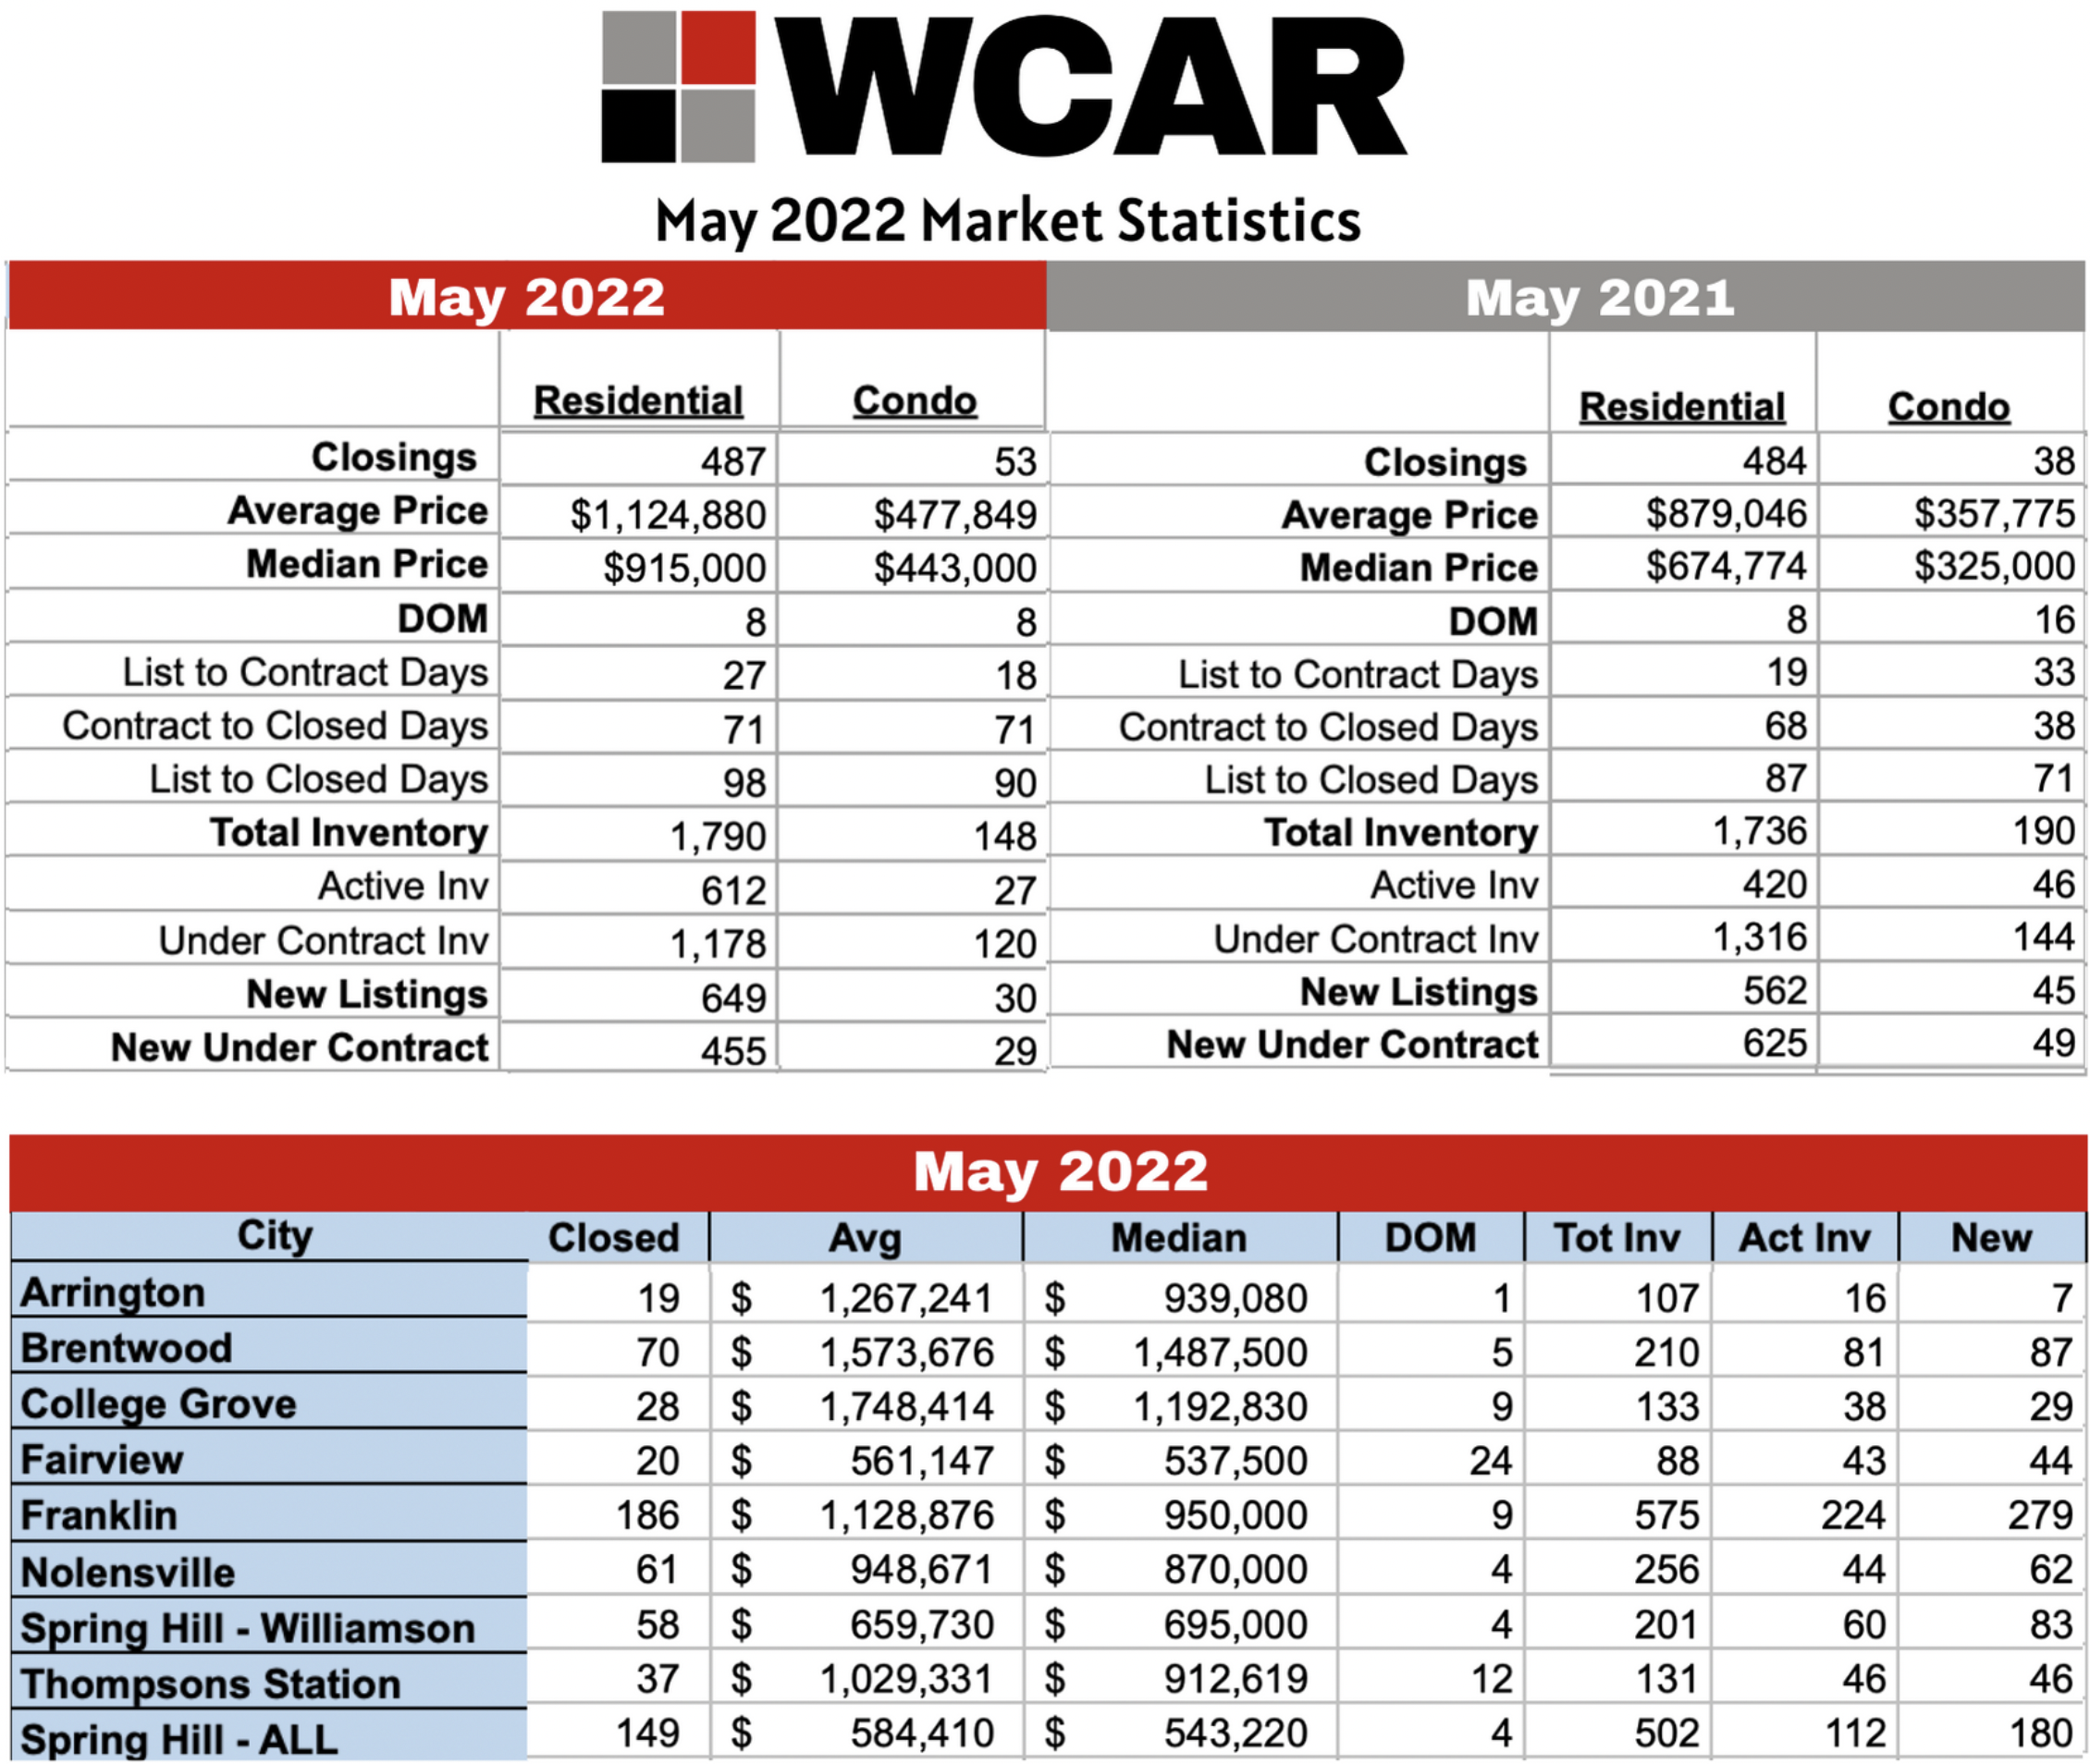 Continuing a trend line, available/active housing inventory in Williamson County rose again last month… up 30% from April, and up 46% from the year before.
New contracts fell 4.61% from April… and were down 27.2% compared to May 2021! In short, more people are selling than during this same time last year, and fewer people are buying.
Greater Nashville Sales Stats (includes Williamson Co.)…
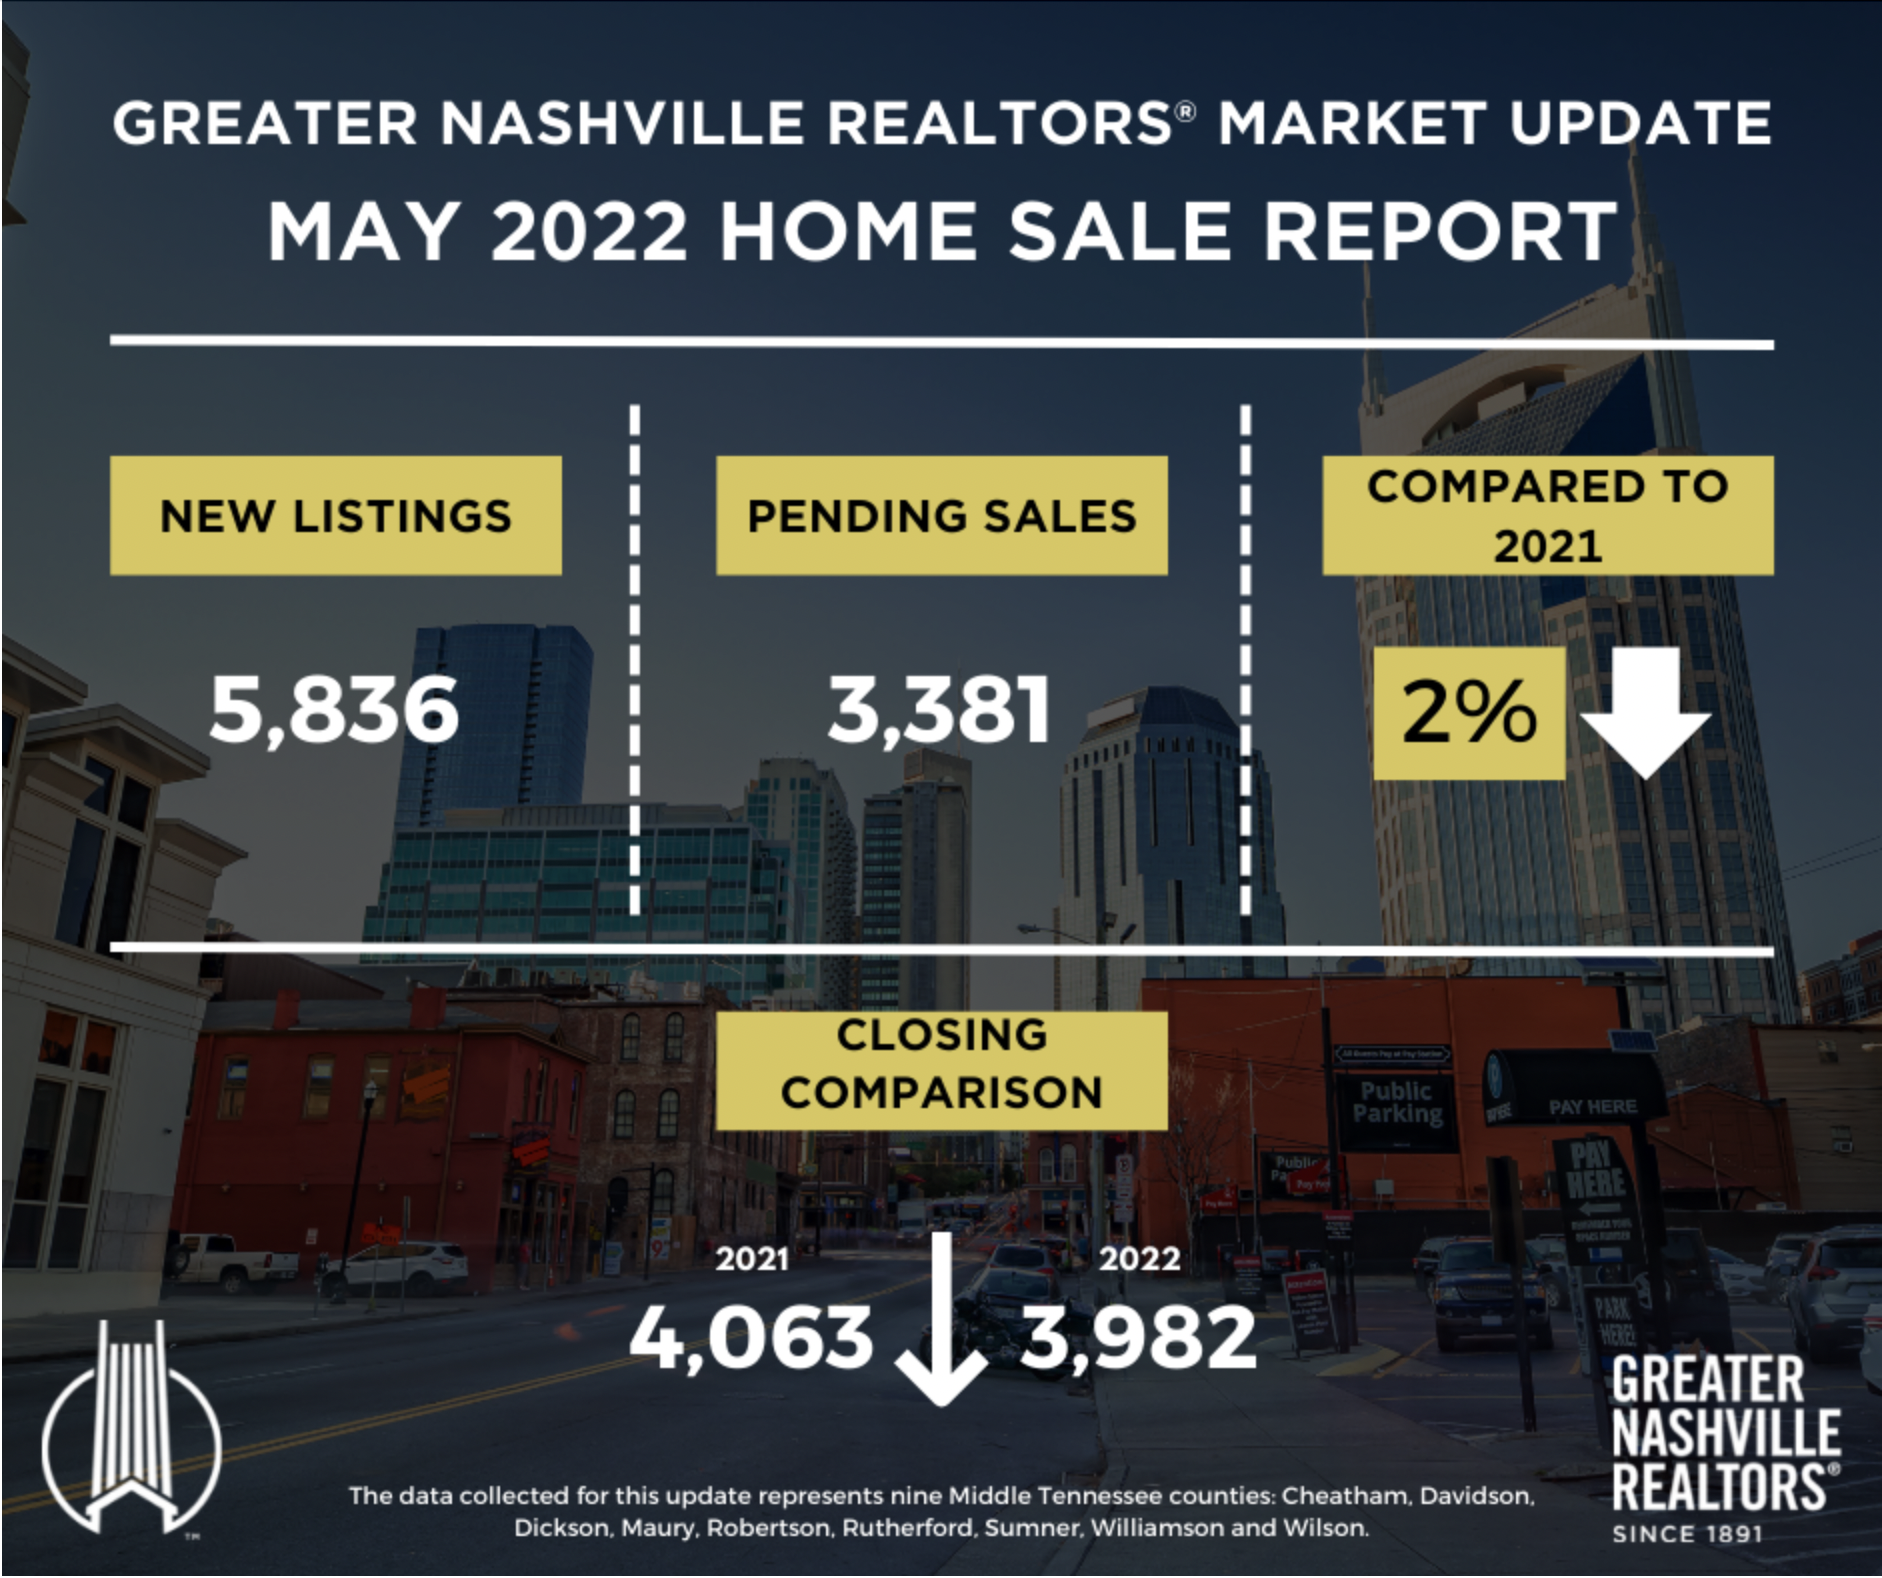
Housing inventory across Greater Nashville climbed more than 35% compared to the month before and the number of pending sales increased, too. However, pending sales relative to available inventory dropped 18% compared to April, which means inventory grew across Greater Nashville, too.
Where Does It Go From Here?…
In order for the market to balance, we’re going to need more inventory, fewer bidding wars, and see days on market move back up. Here’s a look at how the existing homes (resale) market in Nolensville (Williamson County) has fared with days on market and SP/LP % over the past decade:
2022 (year-to-date): 6 days on market | 105.28% Sale Price to List Price Ratio
2021: 7 days on market | 102.66% Sales Price to List Price Ratio
2020: 19 days on market | 99.07% Sales Price to List Price Ratio
2019: 30 days on market | 98.4% Sales Price to List Price Ratio
2018: 30 days on market | 98.57% Sales Price to List Price Ratio
2017: 26 days on market | 98.63% Sales Price to List Price Ratio
2016: 33 days on market | 98.70% Sales Price to List Price Ratio
2015: 32 days on market | 98.40% Sales Price to List Price Ratio
2014: 36 days on market | 97.35% Sales Price to List Price Ratio
2013: 42 days on market | 97.64% Sales Price to List Price Ratio
2012: 57 days on market | 97.66% Sales Price to List Price Ratio
If you’re interested in buying or selling, it’s time to talk.
Give me a call at 615-500-6393 or email me at flint@theguidehome.com and let’s chat about your goals. It may be best for you to stay put, and if so – I’ll give you that honest opinion. But if there’s a window of opportunity, I’m going to help you open it right on up.
Interested in up to date Nolensville TN real estate sales figures? I’ll email you an HOURLY UPDATED look at Nolensville real estate activity including what has gone pending, price-reduced, and withdrawn. Just shoot me an email with your name and preferred email address to flint@theguidehome.com
The Latest on Mortgage Rates…
 6/15/2022 Commentary by Nolensville resident, Jesse Alvarez, with The Mortgage Exchange
Last month we talked about the potential for mortgage rates to keep rising. As I sit here writing this, inflation data over the last few days has reminded us that there will be no easy out and rates have indeed risen. The CPI data released this past Friday was more elevated than most economists expected. Pricing for goods across the board continues to be elevated. And that data was for May, so it doesn’t account for the recent run up in fuel prices that we have seen again as prices have just crept north of $5.00 a gallon.
Inflation continues to be problem. Because of this, the Federal Reserve today announced that it was raising rates 0.75% which would place the overnight Fed Funds rate around 1.58%. They have also raised their future projections on the Fed Funds rate to be 3.4% by the end of this year and 3.8% by the end of next year. The projection of 3.4% by the end of this year is significant because at the previous meeting six weeks ago they were projecting 1.8% by the end of this year. That’s a big increase in where they want to go by the end of this year (and also tells you how very wrong the Fed has been in projecting inflation yet again).
How does this affect the mortgage market? Well, prior to last weeks terrible CPI inflation data, mortgage rates were in the mid to low 5’s. There were even a few lenders still teasing people with 4.99% rates for their best borrowers. Yesterday and earlier today rates got up to the mid to low 6’s for good conventional buyers. As Fed Chairman Powell speaks at his press conference, interest rates have softened up a bit. Hopefully this gets us back under 6% when all is said and done today, but the treasury market still has a lot of information to chew on. The slightly good news is, the MBS (Mortgage Backed Securities) market has seemed to have priced the Fed’s projections over the last few days so unless we see some more upward surprises in inflation data, it looks like the mortgage market should settle in to the upper 5% or lower 6% range for the foreseeable future for 30-year fixed loans. I think at this point economists will err on the high side with projections so it will take some really big surprises to get us up to 7% in mortgages. Probably not going to happen in the next couple months, but it wouldn’t be shocking if it did.
If you are looking for a mortgage over the next month or two and you are nervous about more market instability, talk to your lenders about some “Lock and Shop” products. Under this scenario some lenders will allow you to lock in a rate while you are shopping for your home. They generally charge a slight premium in rate in order to do this, but in rising interest rate conditions it may be worthwhile.
Flint Adam is a 12- year Nolensville resident and lives with his wife and children in Bent Creek. He focuses his real estate practice here in town, having served more than 180 buyers and sellers in closed Nolensville real estate transactions. Flint enjoys blogging about local real estate, traveling the world, photography, and hiking. He is passionate about serving Nolensville and keeping it one of America’s greatest small towns.


