by Flint Adam, Nolensville resident & Realtor®
Thursday, September 8, 2016
 You may have noticed today’s headline in the Tennessean stating that August home sales dipped.
Yes, that happened in Nolensville, too… if we’re comparing August sales to July’s.
However, when we look at the year-over-year numbers, Nolensville (Williamson Co.) accomplished something neither the Williamson County nor Greater Nashville real estate markets as a whole can claim: growth!
More on that down the page, but first… let’s break down August 2016’s single-family residential sales numbers.
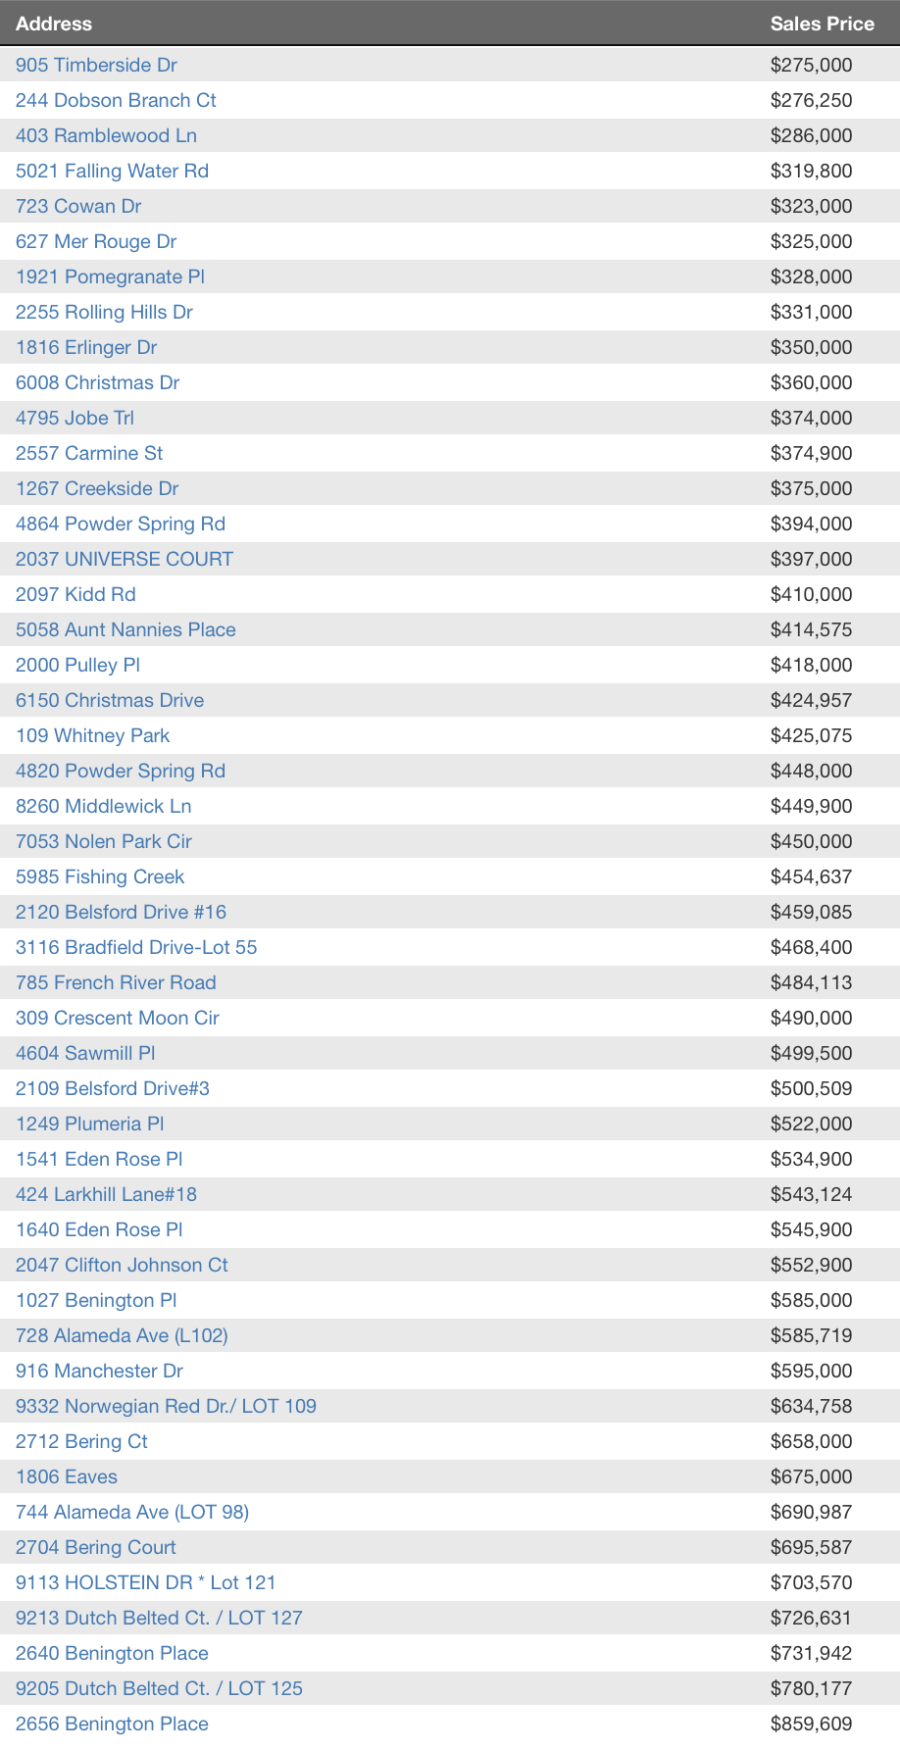
This data comes from my own research along with data by the Williamson County Association of Realtors. Keep in mind these figures do not include For Sale By Owner or Nolensville properties outside of Williamson County:
- Single-Family Homes Closed: 48… down from 60 in July
- Median Sold Price: $456,861… down from $460,724 in July
- Avg. Days on Market: 53… up from 47 in July
- Inventory: 152
- Pending: 51
- Number of new construction sales: 20… down from 30 in July
- Existing home sales: 28… down from 30 in July
- Median Sales Price/Square Foot: $150.82/sf
- Average Year Built: 2010
The highest selling price last month was in Benington – a new construction home that closed at an impressive $859,609!
Note: The above information cites Williamson County sales data for Nolensville, Tennessee. There are, of course, a percentage of Nolensville properties that also exist in Davidson and Rutherford counties, but for the purpose of this article I am focusing on Williamson County since a majority of Nolensville addresses fall within this geographic area.
Nolensville Remains Strong Year-Over-Year
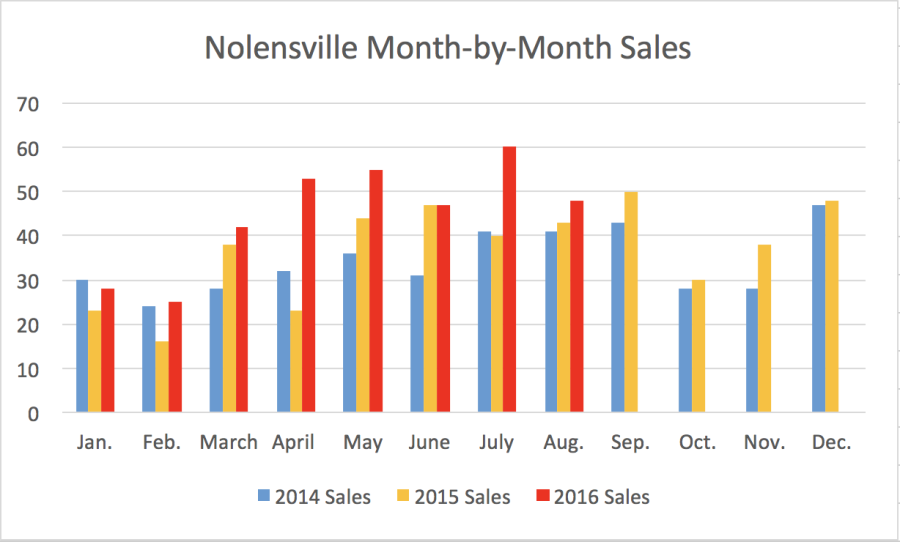
Yes, residential sales in Nolensville dropped 20% from July to August, but that’s partly on account of the HUGE, record-setting July we had when 60 single-family homes closed for the first time. That figure represented a 50% increase in sales from July 2015, and was a pretty darn, difficult act to follow.
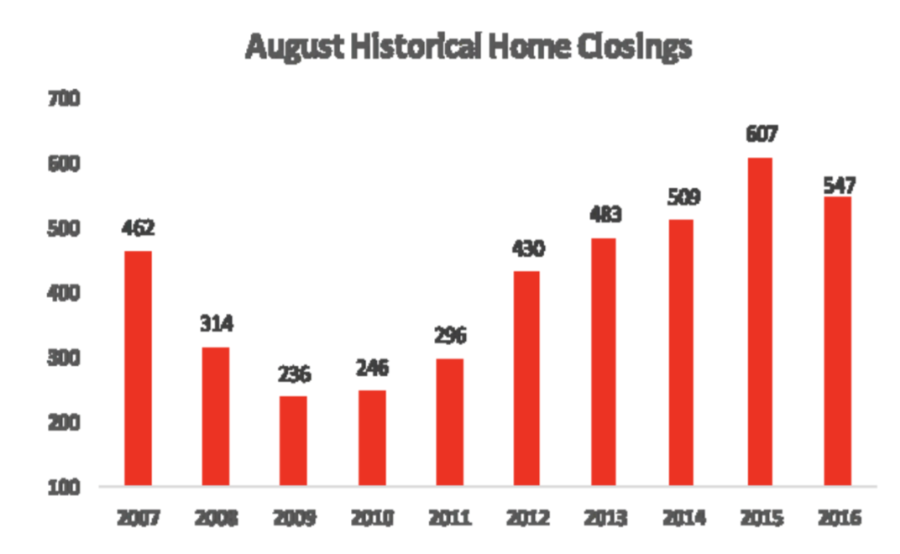
The good news is August 2016 finished with about 12% more sales than the year before. Meanwhile, Williamson County as a whole saw about a 10% drop in total sales… and the Greater Nashville real estate market reported a 0.8% drop year-over-year.
Here is a look at the month-by-month sales-trend over the past three years for Nolensville (Williamson Co.) The impressive stat is that the town has met or exceeded the year-over-year residential sales volume every month so far in 2016.
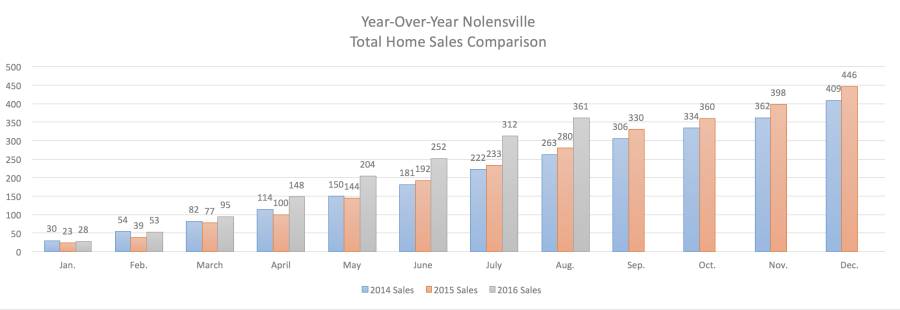
Meanwhile, Nolensville remains on an amazing sales-pace, selling 361 Williamson County addresses through August 31st… a 29% leap over the same time-period in 2015. In fact, the town didn’t get its 361st sale last year until the calendar hit November. WOW!
Interested in up to date Nolensville TN real estate sales figures? I’ll email you a daily update on Nolensville real estate complete with new listings, what has gone pending, and daily sales. Just shoot me an email with your name and preferred email address to flint@homesaroundnashville.com
Williamson County Home Sales Dip…
There is a noteworthy fact regarding Williamson County’s residential sales last month: August 2016 is the first August since 2009 that we’ve seen residential sales drop year-over-year.
According to the Williamson County Association of Realtors® (WCAR), there remains strong buyer demand, but shrinking inventory and escalating home prices slowed things down.
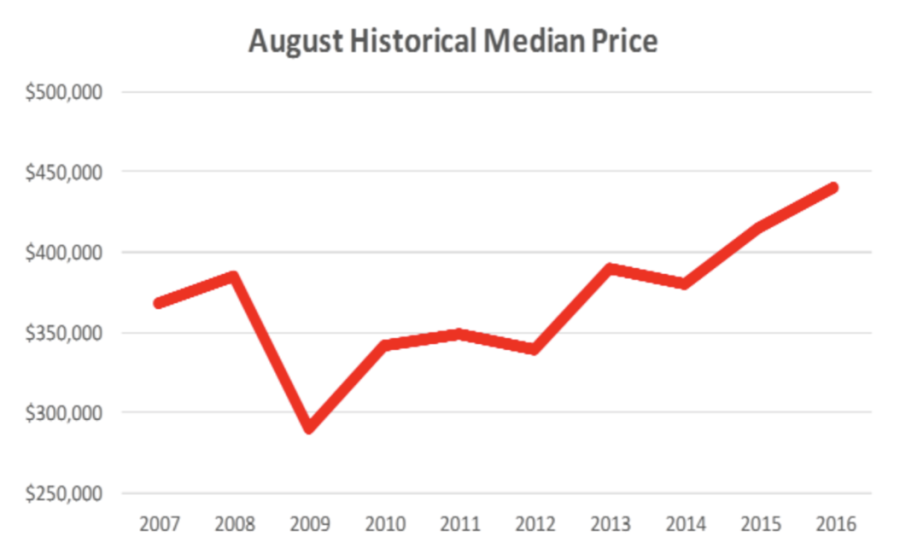
The median sales price for a single-family residence was $441,990 in August 2016, which represents a new record amount for the month of August surpassing the previous record of $415,000 set in August 2015.
Year-to-date home sales in Williamson County are 3,812, an increase of one percent over the 3,772 closings for the same period last year.
From WCAR: Total available residential inventory in Williamson County stood at 1,686 units at the end of August, indicating a three-month supply of available homes. A six-month supply is considered to be a balanced market.
For the month of August, available inventory declined for both single-family homes and condominiums. Single-family home inventory declined 8.5 percent from 1,763 in 2015 to 1,613 listed homes in 2016, while condo inventory fell 24 percent from 96 in 2015 to 73 listings in 2016.
In 2011, there were 27 percent more single-family homes and condos on the market than there are today. Total home closings are nearing double the number of closings compared to five years ago. The median sales price for a single-family home and condo has increased by $92,990 and $40,000, respectively, in the same five-year period.
Mortgage Rates – Holding Low and Steady…
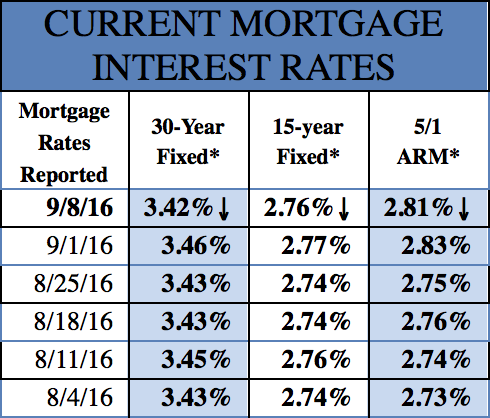
From My Mortgage Insider.com: Mortgages rates continued to hold near their previous levels. This week, however, rates dropped instead of increasing.
Low mortgage rates have made it easier for home buyers to afford a home, but they have also helped refinancers save on their current home.
Over the past week, the 30-year fixed rate mortgage lowered down to 3.44%. Not only is this lower than the previous week’s rate, but it is close to the lowest levels seen in 2016.
Great Buy In Nolensville’s Benington Neighborhood:
Check out my listing at 1508 Pumpkin Ridge Court in Nolensville’s Benington neighborhood! Through the month of September, the sellers are offering $2,000 toward buyer closing costs on an approved Purchase Agreement.
This home also includes a 1-year home warranty… is one of only two in the neighborhood priced under $600,000… and has the second-lowest list price/square foot in Benington! It’s a beautiful, 4,200sf home with a private backyard backing up to woods. Call me today at 615.500.6393 to schedule a showing. Open House this Sunday, September 11th from 2PM-4PM!
I’m a Nolensville TN resident… I’m a Nolensville TN Realtor®… and I always offer a complimentary, no commitment, no pressure Comparative Market Analysis for my neighbors. Please let me know how I may assist you in the sale or purchase of a Nolensville property.


